Hopefully, it’s no secret at this point that Redtail offers Driver Risk Scoring on the data generated by our devices. In fact, it’s an area in which we invest much time, thought and resource to add ever increasing value for our customers.
As a company, we are very big on quality (read my Quality blog post for proof of that), and our Driver Risk Scoring is something we like to pride ourselves on. We think it’s an impressive tool, but we would say that wouldn’t we?! If you don’t believe us, why not let the data do the talking and see for yourself!
Exceptional quality data is something we always strive towards, always making continuous improvements to every part of the Redtail offering.
That’s why we feel so confident in the recent stats that we generated based on Redtail’s Driver Risk Scores analysis. The analysis revealed some very interesting predictors when it comes to driver risk score and its correlation to likelihood of being involved in a crash.
Highest risk drivers are around 4 times more likely to be involved in a crash compared to the average driver (from Redtail’s pool of data).
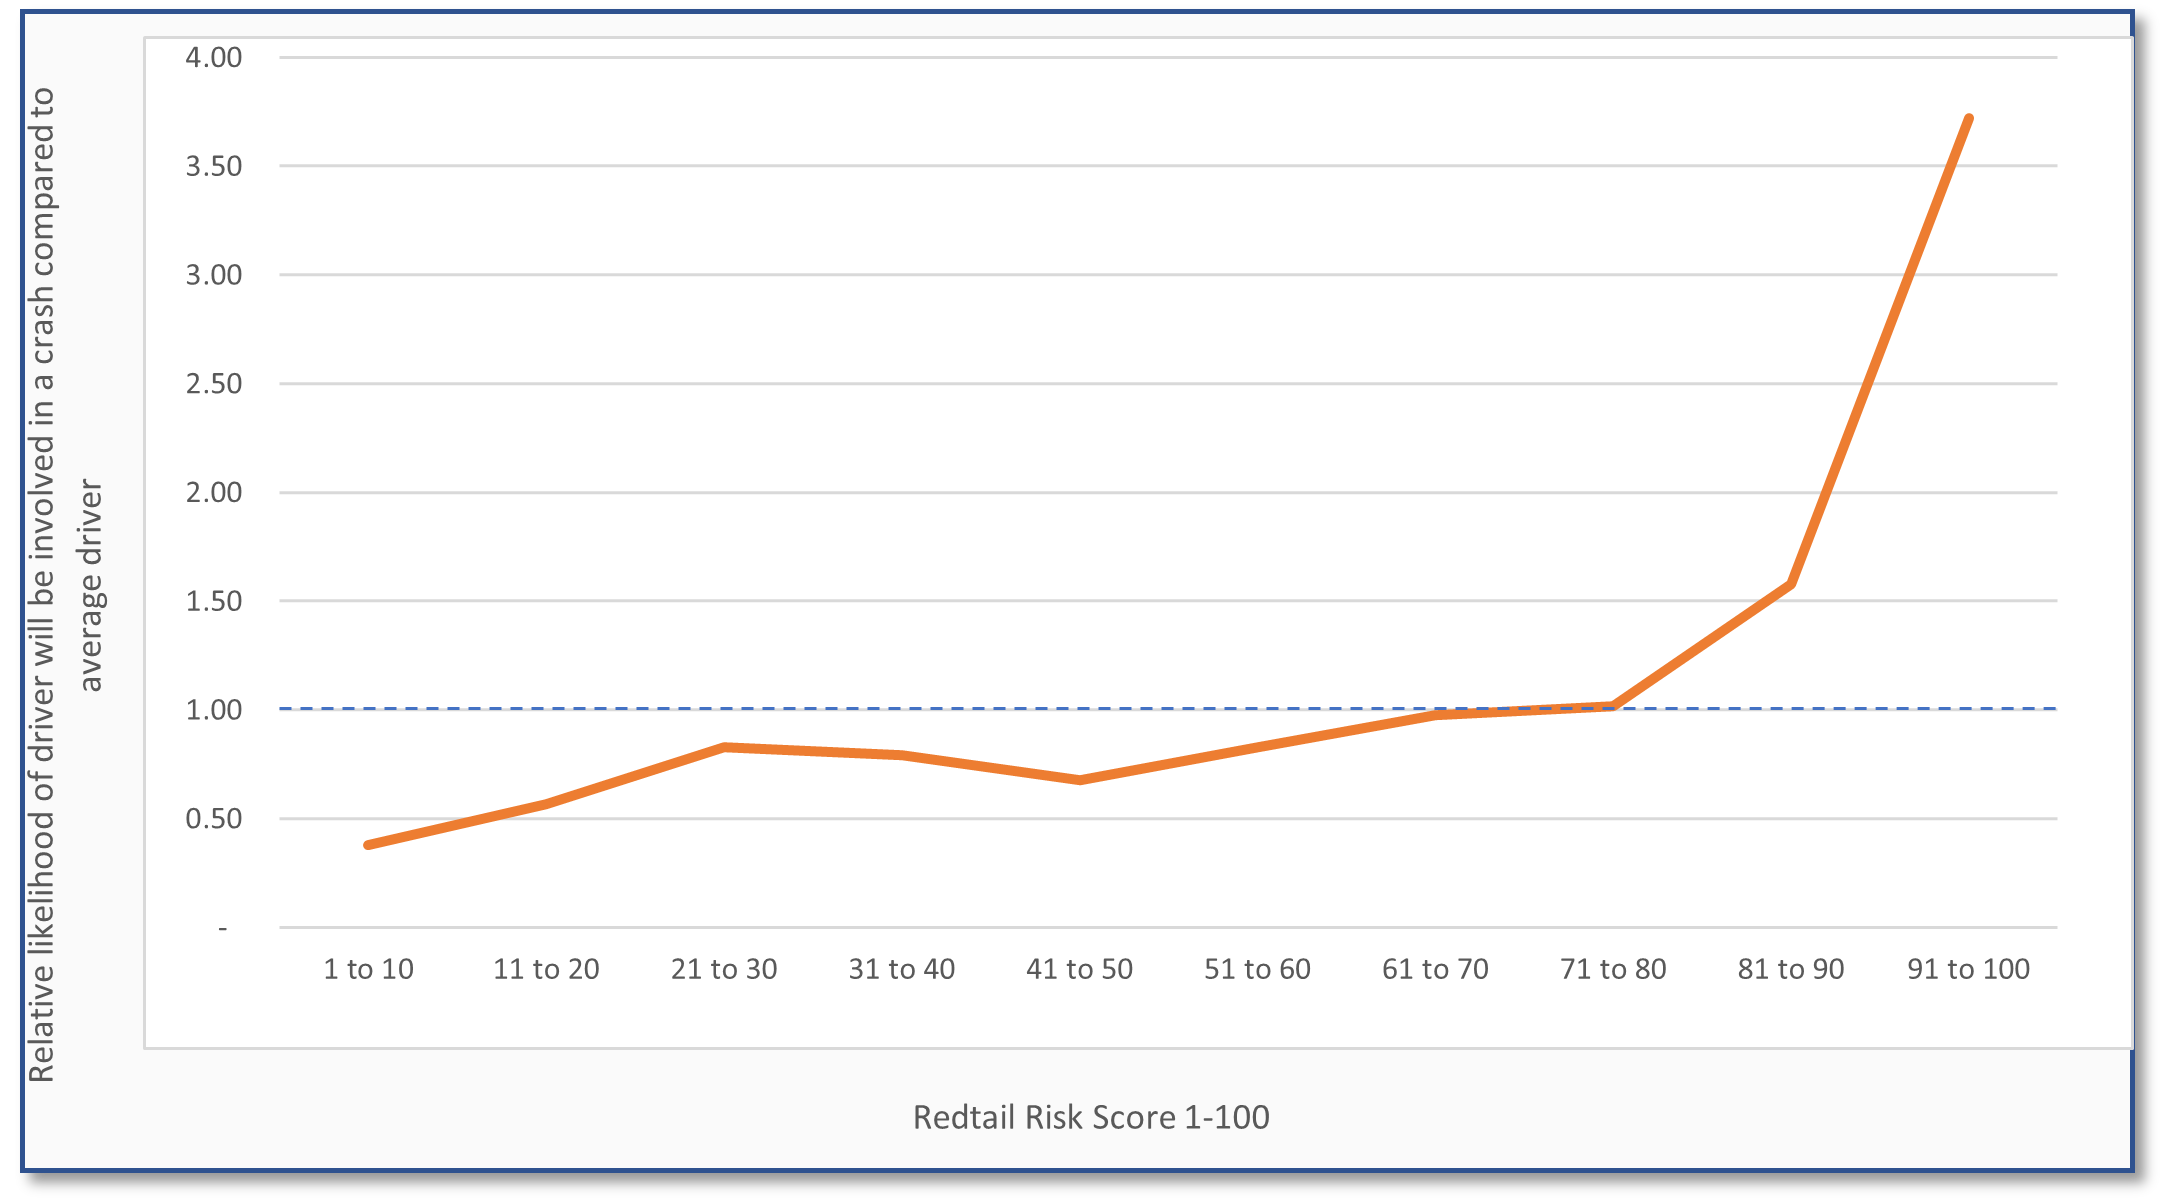
The graph also tells us drivers in the highest risk score band (91-100) 10x more likely to be involved in a crash than those in the lowest risk score band (1-10).
That’s right, highest risk drivers are TEN TIMES more likely to be involved in a crash than the lowest!!
Of course, the correlation is not fully linear as it’s real-life data, where there’s always going to be some randomness. Also, even “good” drivers have crashes sometimes as even the best drivers can’t predict or prevent everything. This data just demonstrates that drivers with the highest risk score are more likely to be involved in a crash.
How do I know if I’m a “high-risk” driver?!
Good question! There are some particularly indicative driver behaviours that Redtail can identify as part of the Risk Score analysis.
For now, I’ll explore 3 of these predictors… I think we’ll be here too long if I try going through them all (there’s a lot). Firstly, let’s discuss Harsh Braking. While this is a very common driving behaviour, it is prevalent in drivers who crash.
By prevalent, I mean drivers who brake harshly are 4 times more likely to have a crash than the average driver, or more.
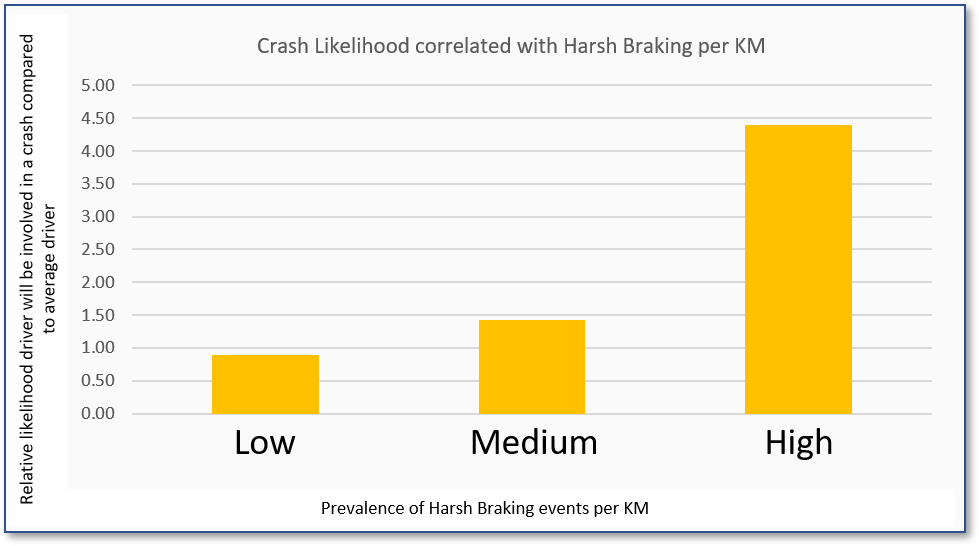
Definition time: Harsh Braking is triggered by a sudden decrease in speed against a predetermined configurable threshold. There are different threshold settings depending on the vehicle’s speed.
Next, let’s talk about Undue Speed. Excessive Undue Speed is dangerous as it shows the driver is travelling at speeds higher than other road users typical for that road at that time of day. This one is important because drivers who spend 8% or more of their time driving at Undue Speeds are more than twice as likely to have a crash. Driving at speeds below that of those around also adds considerably to risk.
That means you’re doubling your crash risk if you spend 8+% of your time driving above the mean speed!!
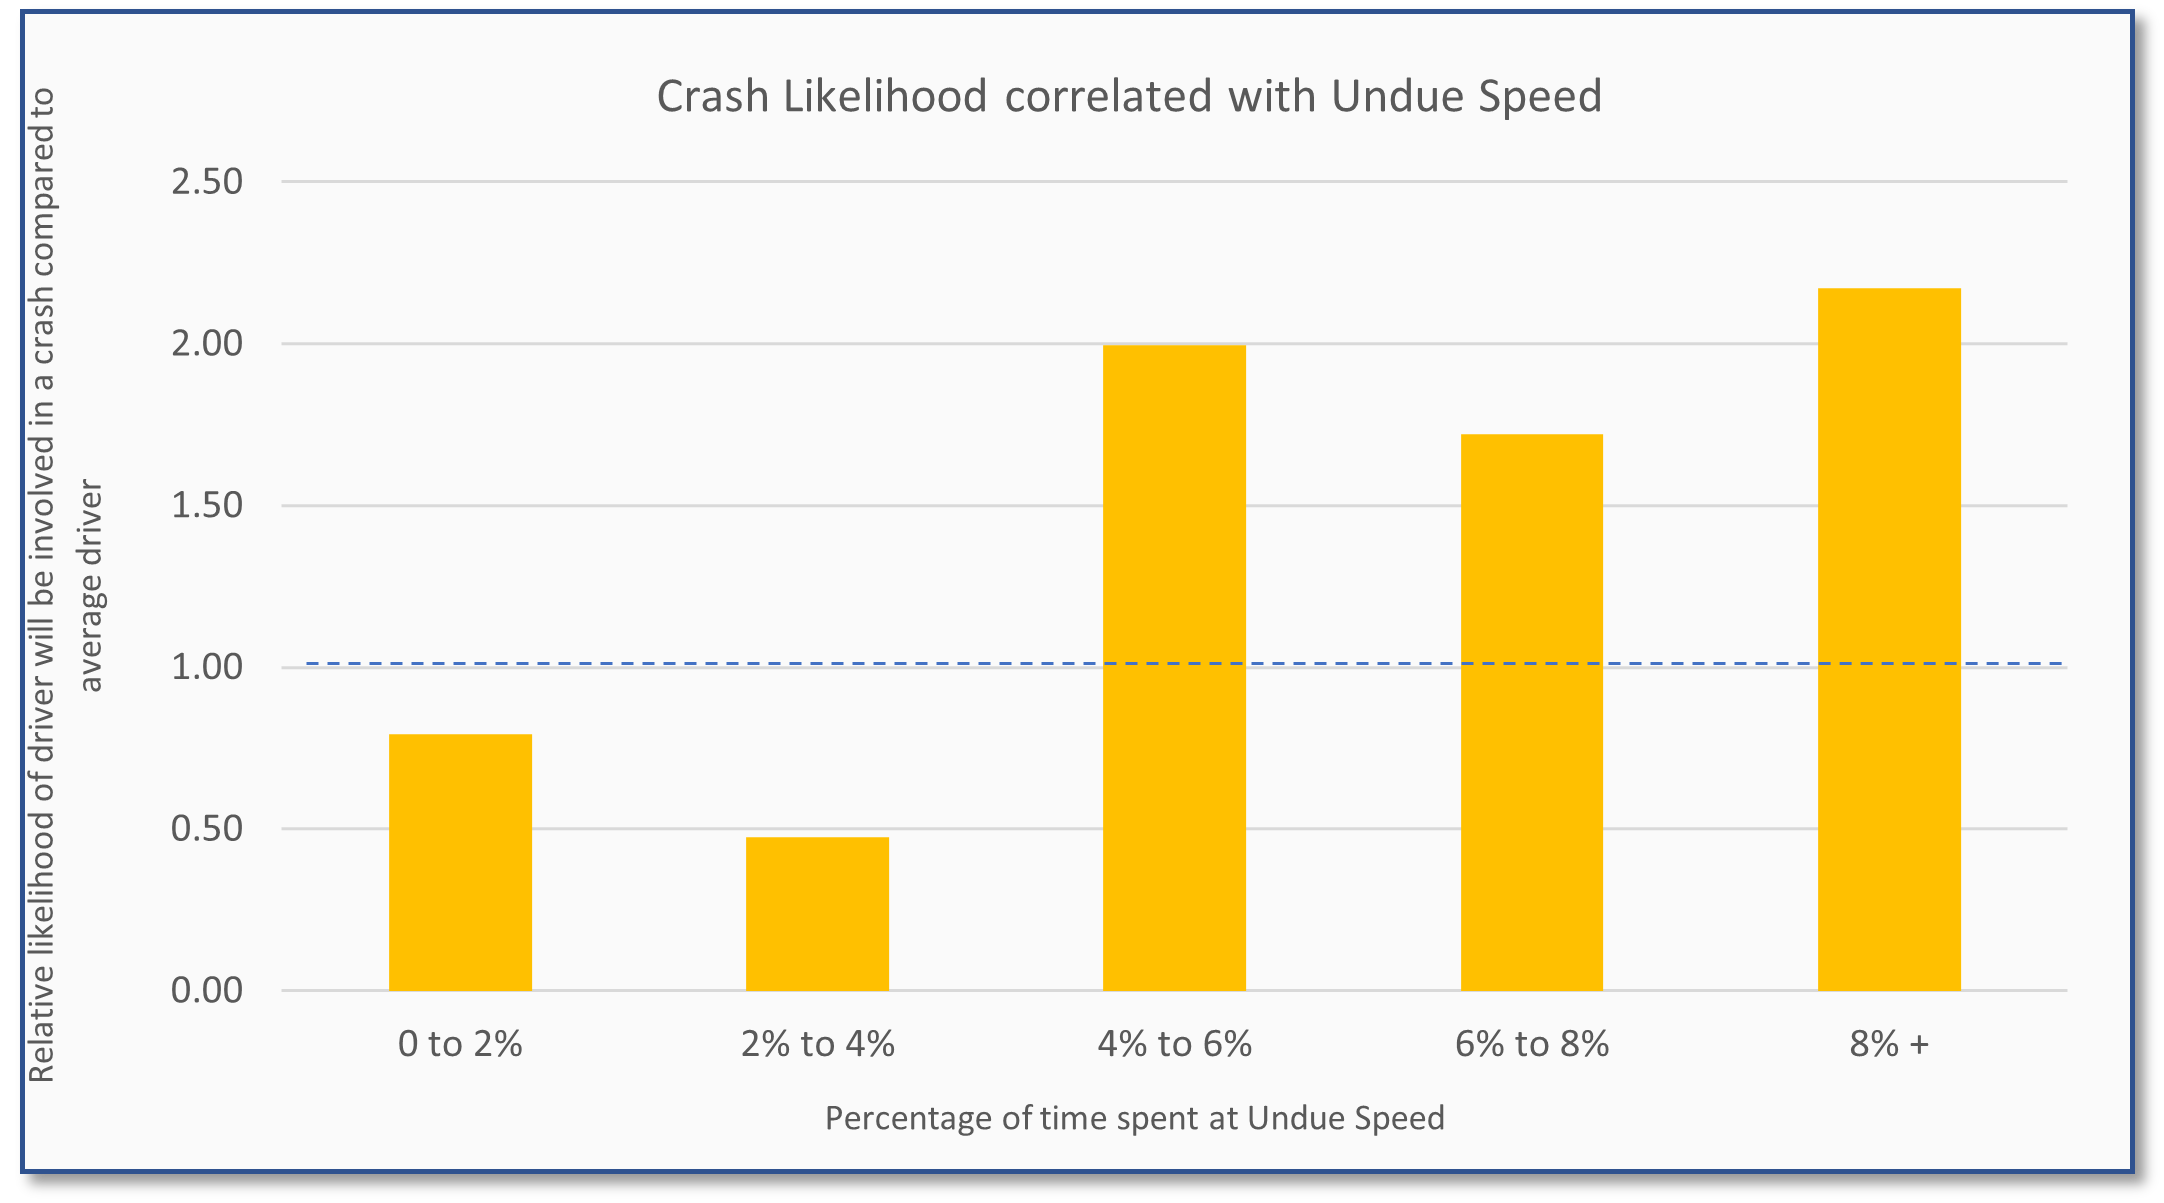
Excessive Undue Speed is dangerous as it shows the driver is travelling at speeds higher than other road users. (N.B. Uses Redtail algorithm, not posted speed).
All I can say is, all this data is definitely enough to make me consciously consider how I drive. I will admit, I’m a bit of a “square” when it comes to speeding. I pay close attention to my speed to always stay within the speed limit. If I had to be honest about my driving, I’d probably have to say it’s my cornering habits that could do with some work (or so I’ve been told – we all think we’re above average drivers though don’t we).